Electricity Data
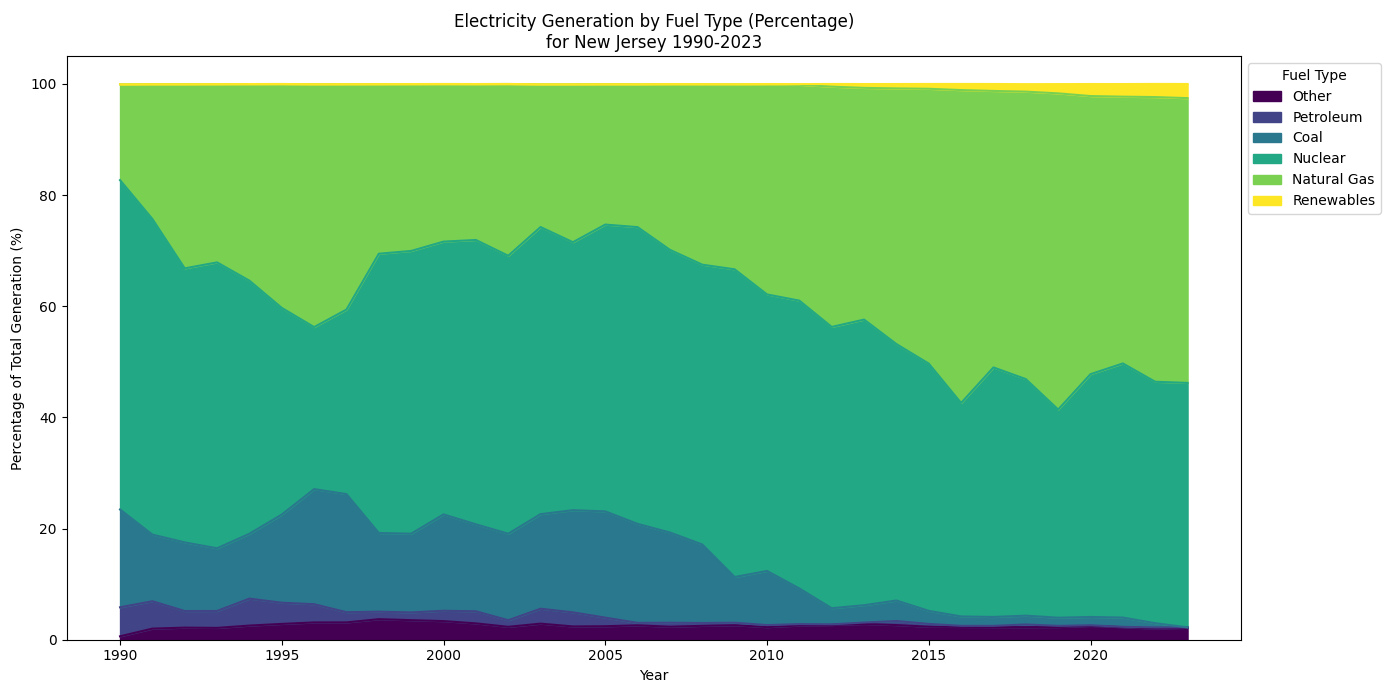
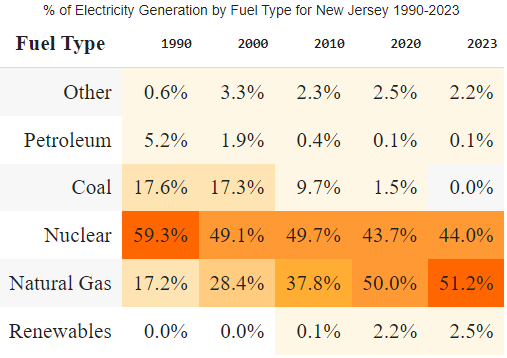
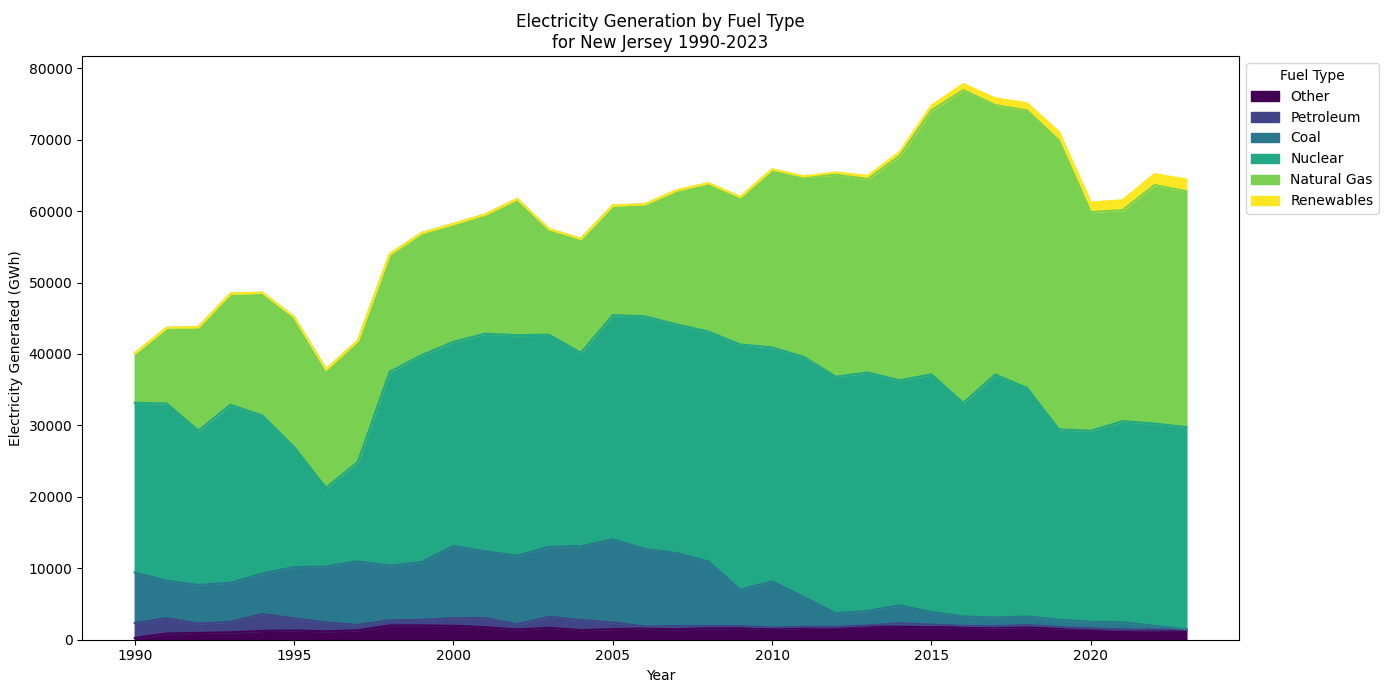
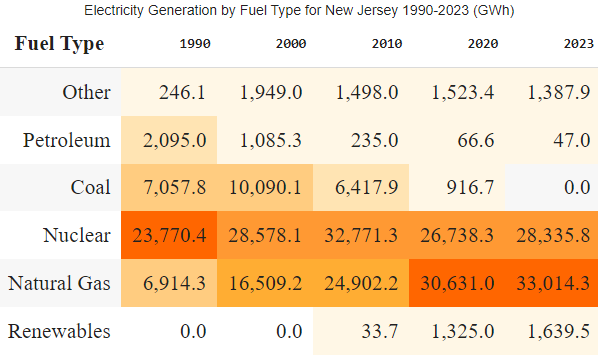
Electricity Generation Data
- New Jersey Generating Data (Generator, Plant, Multi-fuel Unit)
This EIA link directs to the zipped files from survey Form EIA-860. File GeneratorYyy contains generator-level data of counties in New Jersey. Data about generators includes summer and winter capacity, operating months, and energy source; File PlantYyy contains plant-level data on utility service area, sector, regulatory status, and FERC Cogen Docket; File MultiFuelYyy contains generator-level data on fuel-switching and the use of multiple fuels by surveyed generators. All files are available from 2001 to 2016. - New Jersey Total Annual Generating Capacity by Fuel
This EIA link shows fossil fuel consumption in MWh for electricity generation by industry type which includes Total Ehttp://www.eia.gov/electricity/data/state/generation_annual.xlslectric Power Industry, Electric Generators (Electric Utilities), Electric Generators (Independent Power Producers), Combined Heat and Power (Commercial Power), and Combined Heat and Power (Industrial Power). This is an annual dataset available from 1990 to 2015. Total U.S. data are also available on an annual basis. - New Jersey Total Monthly Generating Capacity by Fuel (Megawatt hours)
This EIA link shows fossil fuel consumption for electricity generation by industry type which includes Total Electric Power Industry, Electric Generators (Electric Utilities), Electric Generators (Independent Power Producers),Combined Heat and Power (Commercial Power), and Combined Heat and Power (Industrial Power). This is a monthly dataset available from January 2001 to January 2014. Total U.S data is also available on a monthly basis. - Total U.S. Net Electricity Generation by Energy Source
This EIA link shows U.S. net electricity generation in Million Kilowatt-hours by energy source for all sectors. Data is available monthly from 2004 to 2017. Both traditional and renewable energy sources are covered. - Annual Disturbance Events Archive
This EIA link shows historical annual Major Electricity Disturbances, including the outage and restoration times, area affected, disturbance type, MWs lost, and number of customers affected. This link shows the most current year to date outage information, and this link shows the previous year.
Electricity Consumption Data
- Total New Jersey Historical Hourly Load
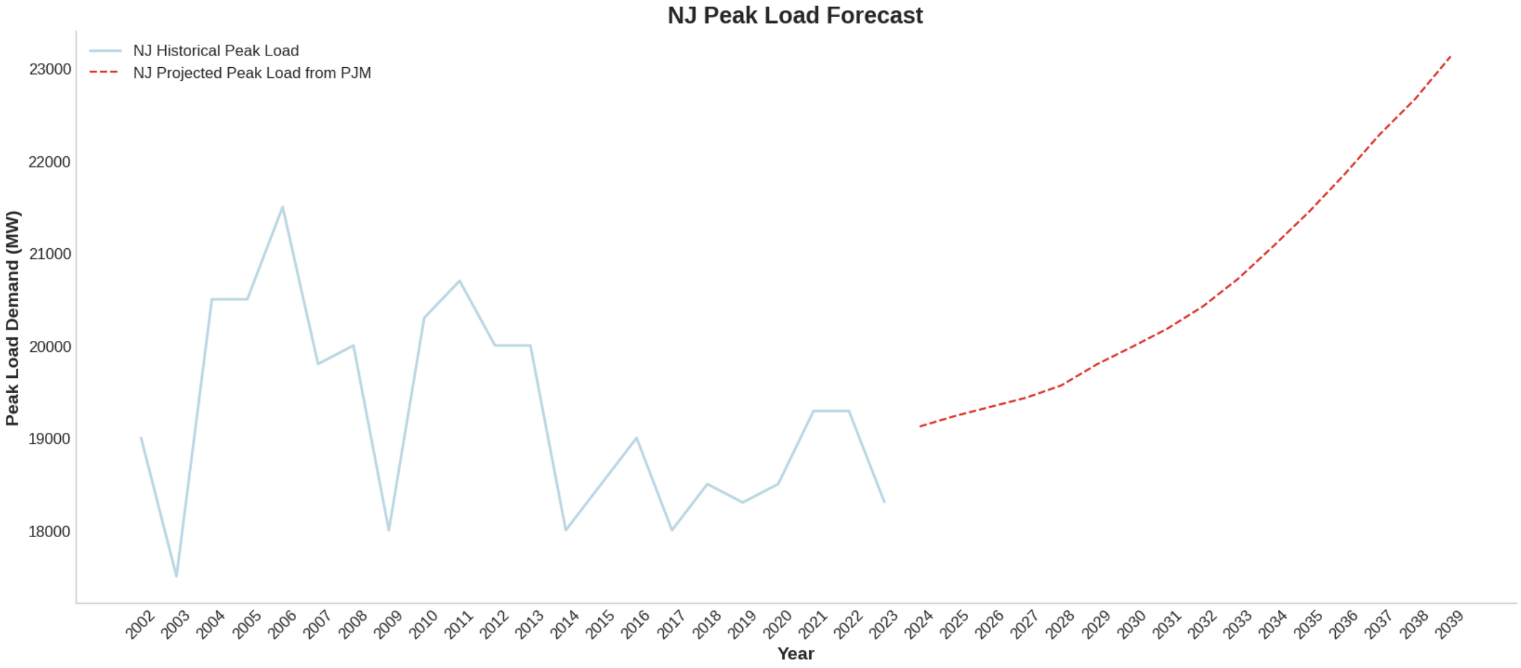
This PJM link shows hourly load in MW-hour as consumed by service territories within the PJM RTO. Data from load zone companies is available on a daily basis since January 1, 1993 and is updated daily. Data by RTO, NERC Region, Market Region, Load Zone, and SubZone are available.
- Total New Jersey Data Monthly Utility Sales by Sector
This EIA link shows retail sales in million kWh of electricity to ultimate customers by end-use sector. Data is available for all Census Divisions and states including New Jersey. This is a monthly dataset showing the most recent month and the same month for the previous year. Sectors include residential, commercial, industrial and transportation. Previous issues of monthly electric power reports back to 1996 are also available from the link. - Utility Level Monthly Utility Sales by sector: Atlantic City Electric, JCP&L, PSE&G, and Rockland Electric
This EIA link is an electric utility data file (EIA-826) which includes utility level retail sales of electricity, associated revenue, and customer count by end-use sector which includes residential, commercial, industrial, transportation, and other. This is a monthly dataset from January 1990 to 2017 for all New Jersey state utilities including Atlantic City Electric, Jersey Central Power & Light, Public Service Electric & Gas, and Rockland Electric.
- Utility Customers Data
This EIA link provides data from Form EIA-861, Annual Electric Power Industry Report. File2 contains information on retail revenue, sales, and customer counts, by State and class of service (including the Transportation sector, after 2003), for each electric distribution utility, or energy service provider. File5 contains aggregate data of the number of customers by State and customer class for Green Pricing and Net Metering programs, as well as (for 2007 forward) the revenue and sales from Green Pricing programs and the energy displaced by Net Metering programs, and (for 2010 forward) installed capacity by generation type: photovoltaic; wind; CHP/Cogen; and other. - Total New Jersey Average Monthly Retail Sales by Sector
This EIA link shows electricity price, sales, and revenue from retail sales to ultimate customers by end-use sector. This is a monthly dataset available from January 1990 to 2017 for all states including New Jersey. Available end-use sectors include residential, commercial, industrial, transportation, and other.
Electricity Price Data
- Total New Jersey Average Monthly Retail Price by Sector
This EIA link shows electricity price, sales, and revenue from retail sales to ultimate customers by end-use sector. This is a monthly dataset available from 1990 to 2017 for all states including New Jersey. Available end-use sectors include residential, commercial, industrial, transportation, and other. - Total New Jersey Wholesale Day Ahead Electricity Prices
This PJM link contains hourly Day-Ahead Energy Market locational marginal pricing (LMP) data ($/MW) in Eastern Prevailing Time (EPT) for all PJM interconnection point locations, including aggregates. Data is available for Atlantic City Electric, Jersey Central Power & Lt, Public Service Electric & Gas, and Rockland Electric starting in June 2000. - Total New Jersey Wholesale Real Time Electricity Prices
This PJM link contains most updated hourly aggregated Real-Time locational marginal pricing (LMP) in $/MW. The data files contain hourly LMP Eastern Prevailing Time (EPT) for all PJM interconnection point locations, including aggregates. Data is available for Atlantic City Electric, Jersey Central Power & Lt, Public Service Electric & Gas, and Rockland Electric starting on April 1 1998. - New Jersey Demand Response Bids
This PJM link contains the Demand Side Response Bids for each day of the month from December 2006 to June 2017. The filename indicates the date for which the bids were effective. Data is delayed by 4 months and the identity of each Demand Side Response site is not revealed by PJM. - New Jersey Basic Generation Services Fixed Price Auction Results
This Basic Generation Service (BGS) link contains information of previous BGS auction results for New Jersey electric distribution companies: PSE&G, ACE, JCP&L and RECO. This is an annual data available from 2002 to 2017. Historical BPU orders approving auction results from 2002 to 2017 are also available from the link. - PJM Capacity Market Data
This PJM link shows the Base Residual Auction Results by Delivery Year from 2007/2008 to 2020/2021. In addition, a variety of data from each auction is available under each delivery year on the page.
Electricity Revenue Data
- Total New Jersey Monthly Utility Revenue by Sector
This EIA link shows revenue from retail sales of electricity to ultimate customers by end-use sector. Data is available for Census Divisions and for all states including New Jersey. This is a monthly dataset showing the most updated month and the same month for the previous year. Available sectors include residential, commercial, industrial and transportation. Previous issues of monthly electric power reports back to June 1996 are also available from the link. - Utility Level Monthly Utility Revenue by Sector: Atlantic City Electric, JCPL, PSE&G, RECO
This EIA link is an electric utility data file (EIA-826) which includes utility level retail sales of electricity and associated revenue by end-use sector including residential, commercial, industrial, transportation, and other. This is a monthly dataset from 1990 to 2017 for New Jersey state utilities including Atlantic City Electric, Jersey Central Power & Lt, Public Service Electric & Gas, and Rockland Electric.
Electricity Market Data
- PJM State of the Market Reports
This PJM link provides the annual state-of-the market reports on the state of competition within, and the efficiency of, the PJM Markets. The annual reports address, among other things, the extent to which prices in the PJM Markets reflect competitive outcomes, the structural competitiveness of the PJM Markets, the effectiveness of bid mitigation rules, and the effectiveness of the PJM Markets in signaling infrastructure investment. The report is available from 1999 to 2017.
Electricity Emission Data
- Total New Jersey Electric Power Emissions (Metric tons)
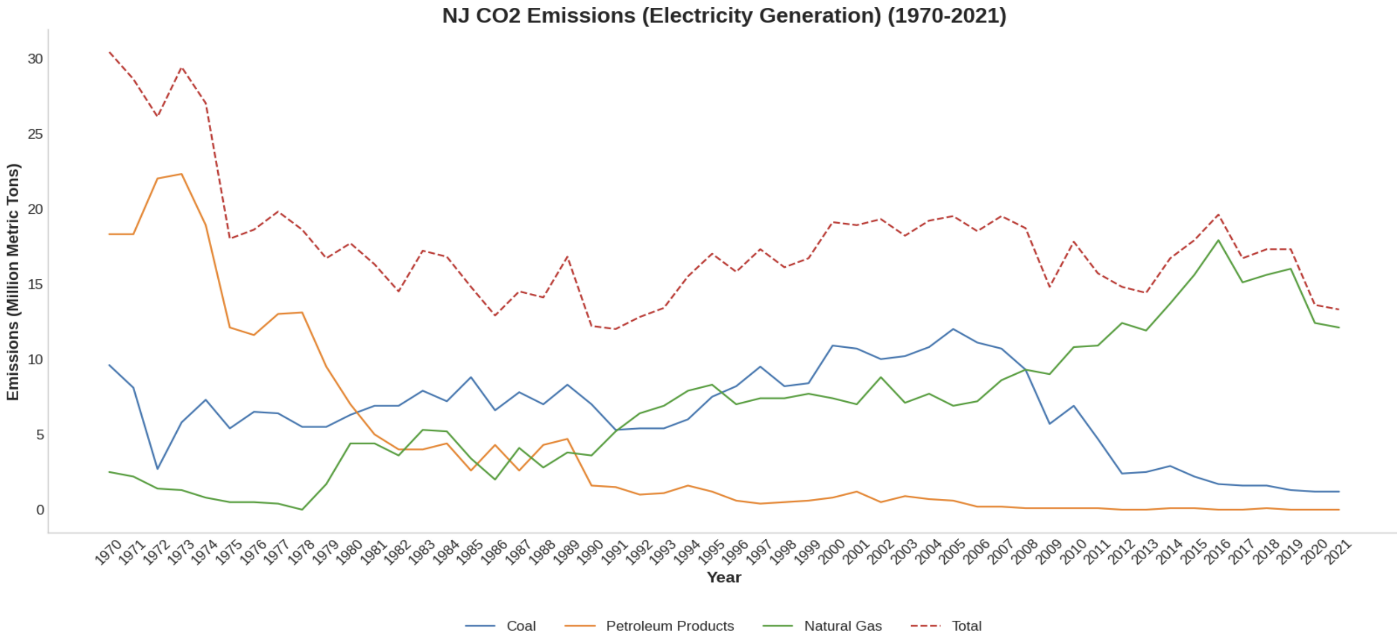
This EIA link shows estimated CO2, SO2 and NOx emissions of Electric Power Industry by type of producers and energy sources which include coal, natural gas, petroleum, and other. This is an annual dataset from 1990 to 2015. Types of producers for each energy source include Electric Utility, IPP NAICS-22 Cogen, IPP NAICS-22 Non-Cogen, Commercial Cogen, Industrial Cogen and Industrial Non-Cogen. Total Electric Power industry data for each energy source is also available.

